Some of the most influential research tools of the last century were created to ensure the quality of beer and extrapolate the results of agriculture experiments conducted in the English countryside. Though ostensibly about the placement of a decimal point, an ongoing debate about the application of these tools also provides a window for understanding what it actually means to manage research data.
The p-value: A very quick introduction
Though now ubiquitous in experiment-based research, statistical techniques for extending inferences from small sample (e.g. the participants in a research study) to larger populations are actually a relatively recent invention. The t-test, an early and still widely used example of “small sample” statistics was developed by William Sealy Gossett in the early 20th century as an economical way of ensuring the quality of stout. Several years later, while assisting with long-term experiments on wheat and grass at Rothamsted Experimental Station, Ronald Fisher would build on the work of Gosset and others to develop a statistical framework based around the idea of comparing observations to the null hypothesis- the position that there is no significant difference between two or more specified sets of observations.
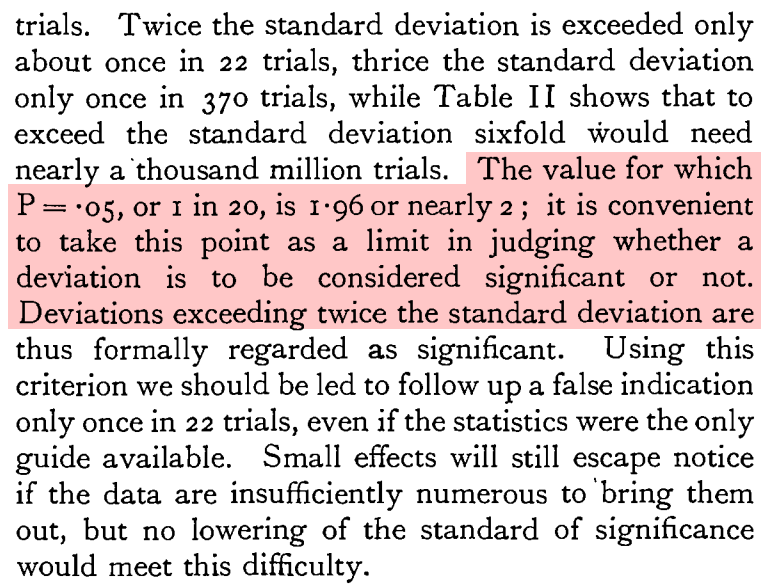
In Fisher’s significance testing framework, devices like t-tests are tests of the null hypothesis. The results of these tests indicate the likelihood of observing a result when the null hypothesis is true. The logic is a little tricky, but the core idea is that these tests give researchers a way of understanding the likelihood that their data is the result of sampling or experimental error. In quantitative terms, this likelihood is known as a p-value. In his highly influential 1925 book, Statistical Methods for Research Workers, Fisher would introduce an informal threshold for rejecting the null hypothesis: p < 0.05.

Despite the vehement objections of all three, Fisher’s work would later be synthesized with that of statisticians Jerzy Neyman and Egon Pearson into a suite of tools that are still widely used in many fields of research. In practice, p < 0.05 has since become a one-size-fits-all indicator of success. For decades it has been acknowledged that work that meets this criterion is generally more likely to be reported in the scholarly literature while work that doesn’t is generally relegated the proverbial file drawer.
Beyond p < 0.05
The p < 0.05 threshold has become a flashpoint the ongoing conversation about research practices, reproducibility, and replicability. Heated conversations about the use and misuse of p-values have been ongoing for decades, but over the summer a group of 72 influential researchers proposed a seemingly simple step forward- change the threshold from 0.05 to 0.005. According to the authors, “Reducing the p-value threshold for claims of new discoveries to 0.005 is an actionable step that will immediately improve reproducibility.”.
As of this writing, two responses have been published. Both weigh the pros and cons of p < 0.005 and argue that the placement of a decimal point is less of a problem than the uncritical use of a single one-size-fits-all threshold across many different circumstances and fields of research. Both end on calls for greater transparency and stronger justifications for how decisions related to research design and statistical practice are made. If the initial paper proposed changing the answer from p < 0.05 to 0.005, both responses highlight the necessity of changing the question from one that is focused on statistics to one that incorporates research data management (RDM).
Ensuring that data can be used and evaluated in the future is one of the primary goals of RDM. For example, the RDM guide we’re developing does not have a space for assessing p-values. Instead, its focus is assessing and advancing practices related to planning for, saving, and documenting data and other research products. Such practices come with their own nuance, learning curves, and jargon, but are important elements to any effort to ensure that research decisions are transparent and justified.
Resources and Additional Reading
Benjamin, D. J., Berger, J. O., Johannesson, M., Nosek, B. A., Wagenmakers, E. J., Berk, R., … & Cesarini, D. (2017). Redefine statistical significance. Nature Human Behaviour. doi: 10.1038/s41562-017-0189-z
Lakens, D., Adolfi, F. G., Albers, C. J., Anvari, F., Apps, M. A. J., Argamon, S. E., … Zwaan, R. A. (2017). Justify your alpha: A response to “Redefine statistical significance”. PsyArxiv preprint. doi: 10.17605/OSF.IO/9S3Y6
McShane, B. B., Gal, D., Gelman, A., Robert, C., & Tackett, J. L. (2017). Abandon statistical significance. arXiv preprint. arXiv: 1709.07588.
Sterling, T. D. (1959). Publication decisions and their possible effects on inferences drawn from tests of significance—or vice versa. Journal of the American Statistical Association, 54(285), 30-34. doi: 10.1080/01621459.1959.10501497
Rosenthal, R. (1979). The file drawer problem and tolerance for null results. Psychological Bulletin, 86(3), 638-641. doi: 10.1037/0033-2909.86.3.638

