(index page)
OA Week 2017: Maximizing the value of research
By John Borghi and Daniella Lowenberg
Happy Friday! This week we’ve defined open data, discussed some notable anecdotes, outlined publisher and funder requirements, and described how open data helps ensure reproducibility. To cap off open access week, let’s talk about one of the principal benefits of open data- it helps to maximize the value of research.

Research is expensive. There are different ways to break it down but, in the United States alone, billions of dollars are spent funding research and development every year. Much of this funding is distributed by federal agencies like the National Institutes of Health (NIH) and the National Science Foundation (NSF), meaning that taxpayer dollars are directly invested in the research process. The budgets of these agencies are under pressure from a variety of sources, meaning that there is increasing pressure on researchers to do more with less. Even if budgets weren’t stagnating, researchers would be obligated to ensure that taxpayer dollars aren’t wasted.
The economic return on investment for federally funded basic research may not be evident for decades and overemphasizing certain outcomes can lead to the issues discussed in yesterday’s post. But making data open doesn’t just refer to giving access other researchers, it also means giving taxpayers access to the research they paid for. Open data also enables reuse and recombination, meaning that a single financial investment can actually fund any number of projects and discoveries.
Research is time consuming. In addition to funding dollars, the cost of research can be measured in the hours it takes to collect, organize, analyse, document, and share data. “The time it takes” is one of the primary reasons cited when researchers are asked why they do not make their data open. However, while certainly takes time to ensure open data is organized and documented in such a way as to enable its use by others, making data open can actually save researchers time over the long run. For example, one consequence of the file drawer problem discussed yesterday is that researchers may inadvertently redo work already completed, but not published, by others. Making data open helps prevents this kind of duplication, which saves time and grant funding. However, the beneficiaries of open data aren’t just for other researchers- the organization and documentation involved in making data open can help researchers from having to redo their own work as well.
Research is expensive and time consuming for more than just researchers. One of the key principles for research involving human participants is beneficence– maximizing possible benefits while minimizing possible risks. Providing access to data by responsibly making it open increases the chances that researchers will be able to use it to make discoveries that result in significant benefits. Said another way, open data ensures that the time and effort graciously contributed by human research participants helps advance knowledge in as many ways as possible.
Making data open is not always easy. Organization and documentation take time. De-identifying sensitive data so that it can be made open responsibly can be less than straightforward. Understanding why doesn’t automatically translate into knowing how. But we hope this week we’ve given you some insight into the advantages of open data, both for individual researchers and for everyone that engages, publishes, pays for, and participates in the research process.
OA Week 2017: Transparency and Reproducibility
By John Borghi and Daniella Lowenberg
Yesterday we talked about about why researchers may have to make their data open, today let’s start talking about why they may want to.
Though some communities have been historically hesitant to do so, researchers appear to be increasingly willing to share their data. Open data even seems to be associated with a citation advantage, meaning that as datasets are accessed and reused, the researchers involved in the original work continue to receive credit. But open data is about more than just complying with mandates and increasing citation counts, it’s also about researchers showing their work.

From discussions about publication decisions to declarations that “most published research findings are false”, concerns about the integrity of the research process go back decades. Nowadays, it is not uncommon to see the term “reproducibility” applied to any effort aimed at addressing the misalignment between good research practices, namely those emphasizing transparency and methodological rigor, and academic reward systems, which generally emphasize the push to publish only the most positive and novel results. Addressing reproducibility means addressing a range of issues related to how research is conducted, published, and ultimately evaluated. But, while the path to reproducibility is a long one, open data represents a crucial step forward.
“While the path to reproducibility is a long one, open data represents a crucial step forward.”
One of the most popular targets of reproducibility-related efforts is p-hacking, a term that refers to the practice of applying different methodological and statistical techniques until non-significant results become significant. The practice of p-hacking is not always intentional, but appears to be quite common. Even putting aside some truly astonishing headlines, p-hacking has been cited as a major contributor to the reproducibility crisis in fields such as psychology and medicine.
One application of open data is sharing the datasets, documentation, and other materials needed to reproduce the results described in a journal article, thus allowing other researchers (including peer reviewers) can check for errors and ensure that the conclusions discussed in the paper are supported by the underlying data and methods. This type of validation doesn’t necessarily prevent p-hacking, but it does increase the degree to which researchers are accountable for explaining marginally significant results.
But the impact of open data on reproducibility goes far beyond just combatting p-hacking. Publication biases such as the file drawer problem, which refers to the tendency of researchers to publish papers describing studies that resulted in positive results while regulating studies that resulted in negative or nonconfirmatory results to the proverbial file drawer. Along with problems related to small sample sizes, this tendency majorly skews the effects described in the scientific literature. Open data provides a means for opening the file drawer, allowing researchers to share all of their results- even those that are negative or nonconfirmatory.
“Open data provides a means for opening the file drawer, allowing researchers to share all of their results- even those that are negative or nonconfirmatory.”
Open data is about researchers showing their work, being transparent about their how they make their conclusions, and providing their data for others to use and evaluate. This allows for validation and helps combat common but questionable research practices like p-hacking. But open data also helps advance reproducibility efforts in a way that is less confrontational, but allowing researchers to open the file drawer and share (and get credit for) all of their work.
OA Week 2017: Policies, Resources, & Guidance
By John Borghi and Daniella Lowenberg
Yesterday, through quotes and anecdotes, we outlined reasons why researchers should consider making their data open. We’ll dive deeper into some of these reasons tomorrow and on Friday, but today we’re focused on mandates.
Increasingly funding agencies and scholarly publishers are mandating that researchers open up their data. Different agencies and publishers have different policies so, if you are a researcher, it can be difficult to understand exactly what you need to do and how you should go about doing it. To help, we’ve compiled a list of links and resources.

Funder Policy Guidance:
The links below outline US federal funding policies as well as non profit and private funder policies. We also recommend getting in touch with your Research Development & Grants office if you have any questions about how the policy may apply to your grant funded research.
US Federal Agency Policies:
http://datasharing.sparcopen.org/data
http://www.library.cmu.edu/datapub/sc/publicaccess/policies/usgovfunders
Global & Private Funder Policies:
https://www.gatesfoundation.org/How-We-Work/General-Information/Open-Access-Policy
https://wellcome.ac.uk/funding/managing-grant/policy-data-software-materials-management-and-sharing
Publisher Policy Guidance:
Below are a list of publishers that oversee thousands of the world’s journals and their applicable data policies. If you have questions about how to comply with these policies we recommend getting in touch with the journal you are aiming to submit to during the research process or before submission to expedite peer review and comply with journal requirements. It is also important to note that if the journal you are submitting to requires data to be publicly available this means that the data underlying the results and conclusions of the manuscript must be submitted, not necessarily the entire study. These data are typically the values behind statistics, data extracted from images, qualitative excerpts, and data necessary to replicate the conclusions.
PLOS: http://journals.plos.org/plosone/s/data-availability
Elsevier: https://www.elsevier.com/about/our-business/policies/research-data#Policy
Springer-Nature: https://www.springernature.com/gp/authors/research-data-policy/springer-nature-journals-data-policy-type/12327134
PNAS: http://www.pnas.org/site/authors/editorialpolicies.xhtml#xi
Resources, Services, and Tools (The How)
Thinking about and preparing your data for publication and free access requires planning before and during the research process. Check out the free Data Management Plan (DMP) Tool: www.dmptool.org
For researchers at participating UC campuses, earth science and ecology (DataONE), and researchers submitting to the UC Press journals Elementa and Collabra, check out Dash, a data publishing platform: dash.ucop.edu
We also recommend checking out www.re3data.org and https://fairsharing.org for standards in your field and repositories both in your field or generally that will help you meet funder and publisher requirements and make your data open.
If you are a UC researcher, click on the name of your campus below for library resources to support researchers with managing, archiving, and sharing research data

OA Week 2017: Stories & Testimonials
By John Borghi and Daniella Lowenberg
Because of the tools and services we offer, we here at UC3 spend a lot of time talking about how to make data open. But, for open access week, we’d also like to take some time to talk about why. We think this is best illustrated by comments we collected from the community as well as excerpts from publications and public statements:
Open Data in order to have a broader reach with your work
Dr. Jonathan Eisen (UC Davis): “Starting in about 2009, we started publishing “data papers” to go with our open release of genome sequence data. These papers just report on the generation of the genome data and not analysis of the data. And these data reports have led to a large number of citations for me and my collaborators. For example for the Genomic Encyclopedia of Bacteria and Archaea project, we have published > 100 genome sequence data reports and these have in total been cited at least a few thousand times.
It is a win win approach for us. We publish papers detailing the generation of open data, which in turn I believe makes people feel more comfortable using that data, when they use the data they cite the papers, and we get more academic and general credit for the data. In the past, when people used our data in Genbank when there was no specific paper on just that data set, people were less likely to cite it.”
Open Data in order to find cures
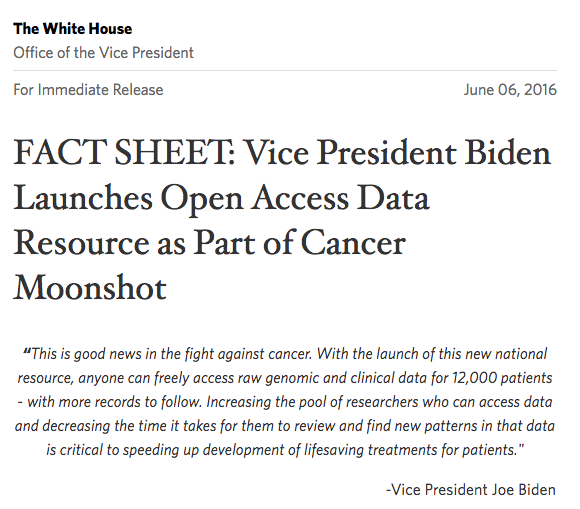
In order to “measure progress by improving patient outcomes, not just publications”, open data is a central feature of the Cancer Moonshot Initiative led by former vice president Joe Biden. Similarly, efforts like clinicaltrials.gov and healthdata.gov aim to expose high value data in the hopes of facilitating better health outcomes.
Open Data in order to aid with the peer review process
Meghan Byrne (Senior Editor, PLOS ONE): “In our experience at PLOS ONE, making data openly available to the reviewers can help move the review process forward more quickly, particularly if the data are clearly reported, with the relevant metadata. In fact, we find that an increasing number of Academic Editors and reviewers are requesting to see the data, so having them ready at the time of submission can help reduce the time to publication. Once the paper is published, making the data publicly available increases the overall impact of the work.”
Open Data in order to advance scientific discovery
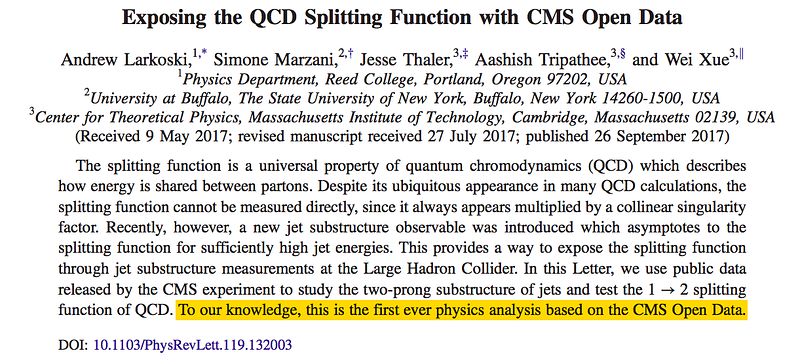
Open data from the Compact Muon Solenoid (CMS) at CERN’s Large Hadron Collider was recently used by researchers outside the organization to confirm a hypothesis about quantum chromodynamics (read more here). Though this is only one example, it is demonstrative of the immense potential for open data to facilitate discovery as new methods and analyses are applied to old data.
Open Data in order to extend the value of research investment
Carly Strasser (Moore Foundation): “We want research that we fund to be widely available. Free and open access to the research outputs that we fund is critical for ensuring maximum impact.”
Welcome to OA Week 2017!
By John Borghi and Daniella Lowenberg
It’s Open Access week and that means it’s time to spotlight and explore Open Data as an essential component to liberating and advancing research.

Let’s Celebrate!
Who: Everyone. Everyone benefits from open research. Researchers opening up their data provides access to the people who paid for it (including taxpayers!), patients, policy makers, and other researchers who may build upon it and use it to expedite discoveries.
What: Making data open means making it available for others to use and examine as they see fit. Open data is about more than just making the data available on its own, it is also about opening up the tools, materials, and documentation that describes how the data were collected and analyzed and why decisions about the data were made.
When: Data can be made open anytime a paper is published, anytime null or negative results are found, anytime data are curated. All the open data, all the time.
Where: If you are a UC researcher, resources free to you are available at each of your campuses Research Data Management library websites. Dash is a data publication platform to make your data open and archived for participating UC campuses, UC Press, and DataONE’s ONEShare. For more open data resources, check out our upcoming post on Wednesday, October 25th.
Why: Data are what support conclusions, discoveries, cures, and policies. Opening up articles for free access to the world is very important, but the articles are only so valuable without the data that went into them.
Follow this week as we cover policies, user stories, resources, economics, and justifications for why researchers should all be making their (de-identified, IRB approved) data freely available.
Tweet to us @UC3CDL with any questions, comments, or contributions you may have.
Upcoming Posts
Tuesday, October 24th: Open Data in Order to… Stories & Testimonials
Wednesday, October 25th: Policies, Resources, & Guidance on How to Make Your Data Open
Thursday, October 26th: Open Data and Reproducibility
Friday, October 27th: Open Data and Maximizing the Value of Research
Doing it Right: Get Credit for Your Research
Join research data specialists from University of California Curation Center to talk about planning, publishing, and getting your data out there.
When: Friday, November 3rd 2:00pm
Where: BIDS, UC Berkeley Doe Library
There will be snacks.
RFI for organizational identifier registry
Organizations/institutions are a key part of the scholarly communications ecosystem. However, we lack an openly licensed, independently run organizational identifier standard to use for common affiliation and citation use cases.
To define a solution to this problem, a group of interested parties drafted and shared a proposal at last year’s PIDapalooza. Based on that discussion, earlier this year Crossref, DataCite and ORCID announced the formation of an Organization Identifier Working Group and UC3 has supported this effort by our Director, John Chodacki, serving as chair of the Working Group.

Scope of Work
The primary goal of our working group (loosely codenamed OrgID or Open PIIR – Open Persistent Institutional Identifier Registry) is to build a plan for how to best fill this gap and our main uses were to facilitate the disambiguation of researcher affiliations.
The working group used a series of breakout groups to refine the structure, principles, and technology specifications for an open, independent, non-profit organization identifier registry. We worked in three interdependent areas: Governance, Product Definition, and Business Model, and recently released for public comment our findings and recommendations for governance and product requirements.
Summary of findings & recommendations
After 9 months, the recommendations are the creation of an open, independent organization/institution identifier registry:
- with capabilities for organizations/institutions to manage their own record,
- seeded with and using open data,
- overseen by an independent governance structure, and
- incubated within a non-profit host organization/institution (providing technical development, operations and other support) during its initial start-up phase.
Request for Information
Our working group has now issued a Request for Information (RFI) to solicit comment and to hear from groups interested in hosting and/or developing this registry.
- Are you interested in serving as a the start-up host organziation?
- Do you have organization data you are willing to contribute?
- Do you have other resources that could be helpful for the project?
- Do you have advice, suggestions, and feedback on creating a sustainable business model for each phase of the Registry’s development?
We’d like to hear from you! Please help spread the word!
Before drafting responses, please also see our original A Way Forward document for additional framing principles. Also, please note that all responses will be reviewed by a subgroup of the Organization Identifier Working Group (that will exclude any RFI respondents).
Update: revised November 1, 2017
As posted above, the working group issued a Request for Information (RFI) on 9 October 2017 to solicit comment and interest from the broader research community in developing the Registry. We have received a number of questions about the RFI. The purpose of this post is to clarify the RFI, the process for reviewing responses, and the next steps for developing the registry. Please use this template to respond to the RFI.
(1) When are the responses due?
We have extended the deadline for responses to 1 December 2017.
(2) Who should be responding?
Any organization interested in (i) providing open data, (ii) participating in a governance role, (iii) serving as technical and/or administrative host for the Registry organization , and / or (iv) providing technology, staffing, or marketing resources.
(3) How much detail should the response include?
A general description of your interest (see (2) above), and a short description of the resources you could bring to the Registry will suffice. We are not requesting a detailed cost proposal. While framing your responses, please see the Governance and Product documents for requirements and principles. Please use this template to respond to the RFI.
(4) How will the responses be reviewed?
Responses will be received by the Organization Identifier Steering Group. In early December, they will develop a summary and list of respondents to share with the full Working Group and the Executive Committees of Crossref, DataCite, and ORCID boards for review. We propose a meeting of stakeholders in late January, potentially the day before the PIDapalooza meeting, to discuss options with the respondents for a collaborative approach to developing the Registry. From there, next steps will be proposed.
(6) Who do I contact if I have more questions?
Please email the Org ID steering group with any questions. Or, if you have any other questions/comments about the involvement of CDL’s UC3 team, let us know at uc3@ucop.edu
The Significance of Managing Research Data
Some of the most influential research tools of the last century were created to ensure the quality of beer and extrapolate the results of agriculture experiments conducted in the English countryside. Though ostensibly about the placement of a decimal point, an ongoing debate about the application of these tools also provides a window for understanding what it actually means to manage research data.
The p-value: A very quick introduction
Though now ubiquitous in experiment-based research, statistical techniques for extending inferences from small sample (e.g. the participants in a research study) to larger populations are actually a relatively recent invention. The t-test, an early and still widely used example of “small sample” statistics was developed by William Sealy Gossett in the early 20th century as an economical way of ensuring the quality of stout. Several years later, while assisting with long-term experiments on wheat and grass at Rothamsted Experimental Station, Ronald Fisher would build on the work of Gosset and others to develop a statistical framework based around the idea of comparing observations to the null hypothesis- the position that there is no significant difference between two or more specified sets of observations.
In Fisher’s significance testing framework, devices like t-tests are tests of the null hypothesis. The results of these tests indicate the likelihood of observing a result when the null hypothesis is true. The logic is a little tricky, but the core idea is that these tests give researchers a way of understanding the likelihood that their data is the result of sampling or experimental error. In quantitative terms, this likelihood is known as a p-value. In his highly influential 1925 book, Statistical Methods for Research Workers, Fisher would introduce an informal threshold for rejecting the null hypothesis: p < 0.05.

Despite the vehement objections of all three, Fisher’s work would later be synthesized with that of statisticians Jerzy Neyman and Egon Pearson into a suite of tools that are still widely used in many fields of research. In practice, p < 0.05 has since become a one-size-fits-all indicator of success. For decades it has been acknowledged that work that meets this criterion is generally more likely to be reported in the scholarly literature while work that doesn’t is generally relegated the proverbial file drawer.
Beyond p < 0.05
The p < 0.05 threshold has become a flashpoint the ongoing conversation about research practices, reproducibility, and replicability. Heated conversations about the use and misuse of p-values have been ongoing for decades, but over the summer a group of 72 influential researchers proposed a seemingly simple step forward- change the threshold from 0.05 to 0.005. According to the authors, “Reducing the p-value threshold for claims of new discoveries to 0.005 is an actionable step that will immediately improve reproducibility.”.
As of this writing, two responses have been published. Both weigh the pros and cons of p < 0.005 and argue that the placement of a decimal point is less of a problem than the uncritical use of a single one-size-fits-all threshold across many different circumstances and fields of research. Both end on calls for greater transparency and stronger justifications for how decisions related to research design and statistical practice are made. If the initial paper proposed changing the answer from p < 0.05 to 0.005, both responses highlight the necessity of changing the question from one that is focused on statistics to one that incorporates research data management (RDM).
Ensuring that data can be used and evaluated in the future is one of the primary goals of RDM. For example, the RDM guide we’re developing does not have a space for assessing p-values. Instead, its focus is assessing and advancing practices related to planning for, saving, and documenting data and other research products. Such practices come with their own nuance, learning curves, and jargon, but are important elements to any effort to ensure that research decisions are transparent and justified.
Resources and Additional Reading
Benjamin, D. J., Berger, J. O., Johannesson, M., Nosek, B. A., Wagenmakers, E. J., Berk, R., … & Cesarini, D. (2017). Redefine statistical significance. Nature Human Behaviour. doi: 10.1038/s41562-017-0189-z
Lakens, D., Adolfi, F. G., Albers, C. J., Anvari, F., Apps, M. A. J., Argamon, S. E., … Zwaan, R. A. (2017). Justify your alpha: A response to “Redefine statistical significance”. PsyArxiv preprint. doi: 10.17605/OSF.IO/9S3Y6
McShane, B. B., Gal, D., Gelman, A., Robert, C., & Tackett, J. L. (2017). Abandon statistical significance. arXiv preprint. arXiv: 1709.07588.
Sterling, T. D. (1959). Publication decisions and their possible effects on inferences drawn from tests of significance—or vice versa. Journal of the American Statistical Association, 54(285), 30-34. doi: 10.1080/01621459.1959.10501497
Rosenthal, R. (1979). The file drawer problem and tolerance for null results. Psychological Bulletin, 86(3), 638-641. doi: 10.1037/0033-2909.86.3.638